HOW TO MAKE A TOPOGRAPHIC MAP USING SKETCHUP
Modelling and analyzing topographic
map becomes more convenient with the aid of modern technology such as online
map surveying and 3-D modelling software.
Most contour lines found in online
topographic maps such as Google map (https://www.google.com.ph/maps), Open Street
Maps (https://www.openstreetmap.org/),
NAMRIA (http://www.namria.gov.ph/),
etc. are labelled with elevations. These topographic elevations found mostly on
online map can only be examined in a macro scale level, showing a minimum of 20 meter contour interval.
Topographic
maps may have many contour lines. The contour interval chosen for a map depends
on topography in the mapped area. In areas with high relief the contour
interval is usually larger to prevent the map from having too many contour
lines. On the other hand, areas with moderate slope required an enormous number
of contour lines in order to show such great detail.
Technically, contour
lines can be drawn for any elevation. Using different 3-D modelling software
such as SketchUp, we can expand the contour interval, producing many contour lines.
This process of expanding the contour interval is applicable in small areas with moderate slope topography.
In this
tutorial, we will learn how to draw contour lines and expand the contour
intervals using SketchUp. Here, we will try to adjust the value of contour
interval from 20 meter to 5 meter.
Before we start the modelling
procedures, we should analyze first the contour interval of the topographic
map. Here’s a quick guide on how to read topographic map.
QUICK GUIDE ON HOW TO READ TOPOGRAPHIC
MAP
 |
| (1) Index Contour, (2) Minor Contour Line, (3) Contour Interval |
To determine the contour interval of a point, you must have a reference line from which to start. This reference line is an index contour (major contour line). Based on the reference map, an index is one that is bolder, darker contour line and has a value written on the line. The value written on the index line is the elevation.
Every
topographic map has a contour interval which remains constant throughout the
drawing. The elevation value of the minor contour lines can be determined
through the counting process from one index contour to another. For instance,
if the first index contour line has a value of 100m and the second index
contour line has a value of 200m, the value of the minor contour lines will be
120m, 140m, 160m, and 180m. Therefore, the contour interval is 20 meter.
 |
| 20 Meter Contour Interval |
6 CARDINAL RULES OF CONTOURS
RULE #1: Contour always occur in
pairs
RULE #2: Contours never cross
RULE #3: Contours have equal
vertical separation
RULE #4: All contour lines close
in themselves
RULE #5: Contours do not merge
RULE #6: The steepest slope is a
line perpendicular to the contour
A. HOW
TO VIEW GOOGLE MAP WITH CONTOUR LINES
 |
STEP 2: Click the menu from the Google
map panel> click the terrain option
|
B. HOW TO CREATE A 3-D TOPOGRAPHIC
MODEL USING SKETCH-UP
 |
STEP 1: Click 'File'> import
image> select the map image> click 'Open'
|
 |
STEP 3: Draw a 1000 x 1000 meter border
line box
|
 |
STEP 4: To draw curves, click the 'Arcs' from the drawing tool> Trace the contour lines from the map> delete any faces that formed when lines were drawn
|
 |
| ELEVATION VALUE |
 |
STEP 6: Ctrl+A (Select all). Using the Sandbox Tool, click the icon ‘From Contours’ or go to Draw>Sandbox>From Contours. This process will automatically generate 3D object(s).
|
 |
RESULT : 3-D Topographic model with 20 meter contour interval
|
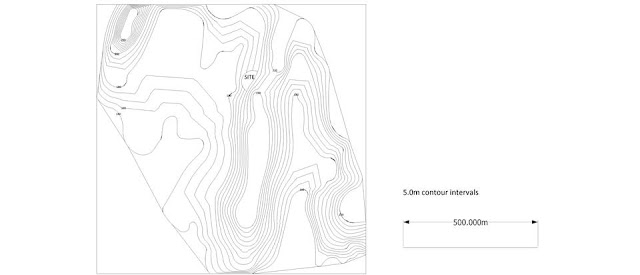
C. HOW TO CREATE A 5 METER CONTOUR
MAP USING SKETCH- UP
Here, we will try to adjust the
contour interval of our 3-D model terrain from 20 meter (Google map contour
reference) to 5 meter contour interval.
 |
| STEP 1: Lock the grouped terrain model and the grouped index contour lines. To do that, select the model> right click> click 'Lock' |
 |
STEP 2: Draw a
square or rectangular plane> make group> move the plane to the lowest
point of the terrain
|
 |
| Square plane |
 |
| STEP 3b: Type 50x (to duplicate the plane)> press Enter |
 |
STEP 4: Select the entire
plane> Right click > make group> Hide
|
 |
| STEP 5: Unlock the terrain model. To do that, select the model> right click> click Unlock. |
 |
| STEP 6: Explode the terrain model. To do that, select the model> right click> click Explode |
 |
| Exploded Model |
 |
| STEP 7: Unhide the grouped plane. To do that, go to Edit> select 'unhide'> click ‘Last’ |
 |
| STEP 8: Select the grouped slicing planes> Right click> choose ‘Intersect Faces’> click ‘With Model.’ This process will enable you to intersect your grouped slicing planes with your terrain model. |
 |
STEP 9: Delete or Hide the
grouped slicing planes.
|
 |
Result so far
|
 |
SUMMARY
|
 |
| FINAL OUTPUT |
 |
| FINAL OUTPUT |


no good !
ReplyDeletewhy?
DeleteWhy no good Sir?
ReplyDeleteThanks.
ReplyDeleteNICE TUTORIAL..THANKS
ReplyDeleteinformative thanks for sharing, people also likes to download cad blocks
ReplyDelete